Eoin O’Mahony, UCD and TCD.
I have been working for a while now with the data produced by the InsideAirBnB project. I teach students how to map and analyse these kinds of datasets when they are learning to use geographic information software. The data are really useful to understand how the city changes, how urban unevenness plays out and what can be done to undermine the ‘sharing economy’. That last phrase in particular, the sharing economy, is very pernicious. Sharing usually involves me giving you something and, maybe, you giving me something. In the case of AirBnB, money is given over for a space to sleep and eat. That doesn’t sound like sharing to me but old fashioned marketised social relations. The same goes for the gig economy: the last time I went to a gig, I wasn’t asked up on stage to pound out a few tunes with The Unthanks.
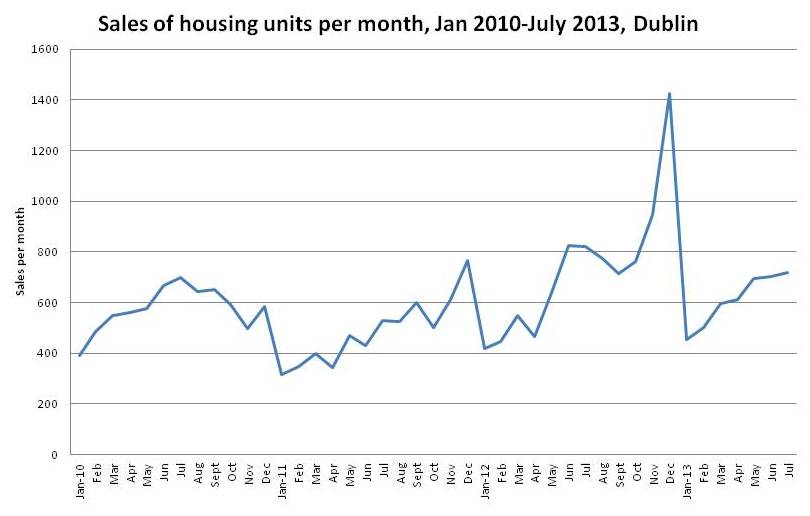
This morning, I read that Dublin City Council have finally published their report on the impact that AirBnB is having on Dublin City’s housing. One of the more significant reported findings is that there are many individual people renting out multiple short lets. Downey’s report for the Council (which I have yet to read) recommends that two Council committees work together to figure out a way to “tackle the issue”. While we await the Council’s prognostications, let’s examine some of the impacts that the most recent batch of data (February 2017) points to. This is a kind of geography of AirBnB in Dublin, a way in which to help analyse the current housing crisis. This is the housing crisis that Coveney would like to solve part of before June, you know, after winning the leadership race of his party. Priorities, right?
Firstly, within the City Council area, there has been an increase in the number of listings between August last year and the February scrape. In August, there were 4,931 listings for the city area – the vast bulk of all Dublin region listings. By February, this had increased to 6,729, an increase of 36%. There must be few other things in the city that have increased by this amount in this period, except perhaps seagull droppings. There has not been a 36% increase in the output of social and affordable homes in the city over this period. There is clearly a number of people out there who have apartments in the city who know that if they rent the spare room or the whole apartment they can make some money. Short-term lettings like these allow people the flexibility to rent some weekends and not others but also to pay a mortgage on a second (or fifth or eighth) rental property they just happen to have lying around. It beats having long term tenants it would seem. Perhaps significantly, the proportion of listings that rents the whole property out (as opposed to a room) has remained stable at 47% of all listings. So where are these listings located?
One of the really good features of a geographic information system (software that allows for spatial analysis) is to be able to see patterns across the city. I conducted a point-in-polygon analysis of the data from the February 2017 listings dataset. As the name implies, this counts the number of listings within each predefined area, in this case electoral divisions (EDs). There are 162 EDs in the DCC area. Location information for these listings are anonymized by Airbnb so any scraping process encounters the following spatial constraints:
- the location for a listing on the map, or in the data will be up to 150 metres from the actual address.
- listings in the same building are anonymized by Airbnb individually, and therefore appear “scattered” in the area surrounding the actual address.
I would be interested to see how Downey may have compensated for this in his report for the Council. Any point-in-polygon analysis is therefore compromised by these two constraints. Knowing this, what spatial patterns can we see? The average number of listings per ED is about 34. In the first map below we can see the distribution of listings below, around (±10), and above the average.
Edit: dynamic map is now available here.

The parts of the city that have above average listings include the docklands, the north inner city around Mountjoy Square and near Stoneybatter. By the far the largest concentrations of listings are seen south of the river, particularly in the south docklands and around Temple Bar. Focusing on those EDs with 100 or more listings, it is clear that the areas south of the river have many more listings than those north of it. This may point to a greater availability in these areas.

Interestingly, the gap between in the southside of the map above contains the areas fancifully known as ‘the Georgian core’. The sabre-shaped ED known as South Dock has well over 300 listings. This takes in an area including the south docklands as well as the area immediately to the south and east of Trinity College. In and around the City Council building on Wood Quay is an area of high concentrations. Thanks to a suggestion by Martin at NCG, I then normalised these listings data by the number of housing units per ED from the 2011 Census. This gave a slightly different geography to the listings data. The average per area is a little under 2% of all housing units. Again, I classified the normalised listings data by below, around and above average but have not displayed the below average areas. We can note a number of differences, as is clear from the final map below.

13% of the units in south inner city are listed as AirBnB-available units. About 9% of the units South Dock are. The Georgian core comes back into play. The heaviest concentrations of listings are therefore found in the south inner city, heading west. I would like to read Downey’s report on this before I do any more work on these data. What’s not clear to me of course is if the Council is going to take any concrete actions to at least curb the power of property to yield profits in the middle of the city’s worst housing crisis. As Lorcan Sirr has indicated recently, some in control of this city have a strange relationship of denial with data. Action would require the Councillors to push back against the primacy of private property so you know…..not much will happen unless we organise like they’ve done in Barcelona and elsewhere.


July 15, 2016
The relationship between population change and housing vacancy in Ireland
Posted by irelandafternama under #Commentaries, Data, Housing, Planning | Tags: census 2016, housing, Ireland, planning, population change, vacancy |Leave a Comment
The prelim results for Census 2016 make it clear that housing vacancy continues to be a serious issue in Ireland. Given that new housing units grew by only 18,981 to 2,022,895 and population grew by 169,724 to 4,757,976m between 2011 and 2016, one might have expected vacancy to have fallen substantially. However, housing unit vacancy fell by only 29,889 to 259,562. Of these 61,204 are holiday homes (HHs), a slight growth of 1,809 from 2011. On a base level vacancy of 6%, oversupply is 76,984.
Vacancy and oversupply varies geographically as Map 1 demonstrates. Excluding holiday homes all but three local authorities – South Dublin (4%), Dún Laoghaire-Rathdown (5.7%) and Fingal (5.3%) – having vacancy rates (exc. HHs) above base vacancy. In several cases housing vacancy (exc. HHs) is running above 10% and four local authorities have rates above 15%. The issue is particularly acute in the north west.
Map 1: Housing vacancy (exc. HHs) in Ireland
One might expect that the vacancy rate has been declining everywhere, but this is far from the case. In fact, vacancy has been rising in many EDs. In Figure 1, each dot is an ED, with each dot above the line representing an increase in vacancy (exc. HHs). In some cases the increase is quite dramatic.
Here, we want to look at the latter since a large number of EDs lost population between 2011-2016, especially those in rural areas (with towns in rural counties growing).
Map 2 shows population and vacancy (exc. HHs) categorised into four classes.
Without further analysis it’s not possible to determine the causes of this inverse relationship. However, what the data does show us is that how housing vacancy is unfolding is not universal and there are different social and spatial processes at work.
Rob Kitchin and Martin Charlton
Share this: