The prelim results for Census 2016 make it clear that housing vacancy continues to be a serious issue in Ireland. Given that new housing units grew by only 18,981 to 2,022,895 and population grew by 169,724 to 4,757,976m between 2011 and 2016, one might have expected vacancy to have fallen substantially. However, housing unit vacancy fell by only 29,889 to 259,562. Of these 61,204 are holiday homes (HHs), a slight growth of 1,809 from 2011. On a base level vacancy of 6%, oversupply is 76,984.
Vacancy and oversupply varies geographically as Map 1 demonstrates. Excluding holiday homes all but three local authorities – South Dublin (4%), Dún Laoghaire-Rathdown (5.7%) and Fingal (5.3%) – having vacancy rates (exc. HHs) above base vacancy. In several cases housing vacancy (exc. HHs) is running above 10% and four local authorities have rates above 15%. The issue is particularly acute in the north west.

Map 1: Housing vacancy (exc. HHs) in Ireland
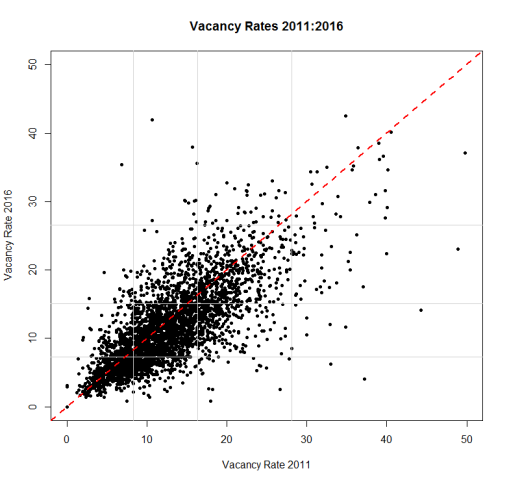
One might expect that the vacancy rate has been declining everywhere, but this is far from the case. In fact, vacancy has been rising in many EDs. In Figure 1, each dot is an ED, with each dot above the line representing an increase in vacancy (exc. HHs). In some cases the increase is quite dramatic.
 So, the question is what has led some EDs to increase in vacancy? Some of it is obsolescence – in any housing market 3-5 properties drop out of use in a year. Some of it might be properties under-construction and on unfinished estates being completed (and thus counted) but are not yet occupied. And some of it will be related to population change and migration.
Here, we want to look at the latter since a large number of EDs lost population between 2011-2016, especially those in rural areas (with towns in rural counties growing).
Map 2 shows population and vacancy (exc. HHs) categorised into four classes.
- (light blue): population decreased and vacancy decreased (687)
- (blue): population decreased and vacancy increased (705)
- (red): population increased and vacancy decreased (1497)
- (light red): population increased and vacancy increased (517)
 The relationship we would expect would be classes 2 and 3 – where population decreased, vacancy increased, and where population increased, vacancy decreased. And that happens in 2022 EDs (out of 3406). However, in 1204 cases (c. a third), something odd happens: as population increases, vacancy increases (517 cases), or as population decreases, vacancy decreases (687 cases). In the case of the latter this might be explained by obsolescence and household fragmentation. We would be interested to hear of other possible explanations.
Without further analysis it’s not possible to determine the causes of this inverse relationship. However, what the data does show us is that how housing vacancy is unfolding is not universal and there are different social and spatial processes at work.
Rob Kitchin and Martin Charlton

July 15, 2016
The relationship between population change and housing vacancy in Ireland
Posted by irelandafternama under #Commentaries, Data, Housing, Planning | Tags: census 2016, housing, Ireland, planning, population change, vacancy |Leave a Comment
The prelim results for Census 2016 make it clear that housing vacancy continues to be a serious issue in Ireland. Given that new housing units grew by only 18,981 to 2,022,895 and population grew by 169,724 to 4,757,976m between 2011 and 2016, one might have expected vacancy to have fallen substantially. However, housing unit vacancy fell by only 29,889 to 259,562. Of these 61,204 are holiday homes (HHs), a slight growth of 1,809 from 2011. On a base level vacancy of 6%, oversupply is 76,984.
Vacancy and oversupply varies geographically as Map 1 demonstrates. Excluding holiday homes all but three local authorities – South Dublin (4%), Dún Laoghaire-Rathdown (5.7%) and Fingal (5.3%) – having vacancy rates (exc. HHs) above base vacancy. In several cases housing vacancy (exc. HHs) is running above 10% and four local authorities have rates above 15%. The issue is particularly acute in the north west.
Map 1: Housing vacancy (exc. HHs) in Ireland
One might expect that the vacancy rate has been declining everywhere, but this is far from the case. In fact, vacancy has been rising in many EDs. In Figure 1, each dot is an ED, with each dot above the line representing an increase in vacancy (exc. HHs). In some cases the increase is quite dramatic.
Here, we want to look at the latter since a large number of EDs lost population between 2011-2016, especially those in rural areas (with towns in rural counties growing).
Map 2 shows population and vacancy (exc. HHs) categorised into four classes.
Without further analysis it’s not possible to determine the causes of this inverse relationship. However, what the data does show us is that how housing vacancy is unfolding is not universal and there are different social and spatial processes at work.
Rob Kitchin and Martin Charlton
Share this:
Related