There’s been an awful lot of rhetoric recently that the housing market is picking up in Dublin and that trading is brisk relative to what it was a couple of years ago. Most of that rhetoric is coming from the property sector backed up with ancedotal evidence. The question is whether this is reflected in the hard data of the house price register? Here is a graph of the number of housing unit sales per month since January 2010 for Dublin.
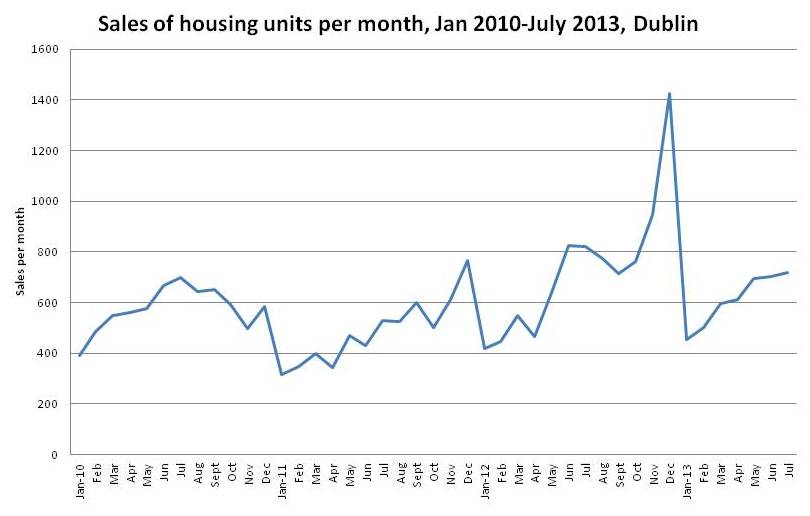
What the data shows is that housing unit sales are relatively consistent over the past three and a half years, except for a brief surge at the end of 2012, with December 2012 seeming to be anomaly (probably based around the ending of mortgage interest relief). The first six months of 2013 are very similar in pattern to 2010. In fact, in the first six months of 2013 only 328 more units have been sold than the first six months of 2010. The data does not suggest then that there has been a bounce back in market activity to any significant degree. What it shows instead is a relatively steady turnover of property. Market activity in terms of increased viewings on properties, but not in sales, may well reflect a relatively restricted pool of some kinds of properties (family homes; which the property sector is saying is the case).
In general terms, the sales figures reveals that the market is still a very pale shadow of the height of the boom. The Dublin housing market consists of 527,665 units (in 4 Dublin LAs according to Census 2011). Normal market turnover would be 5-7% units (higher in a boom), meaning that we could realistically expect in a normally functioning market 2200-3100 sales per month. So far in 2013 the average monthly sales is 593 (1.3% turnover).
The Dublin market may be stabilising at the bottom of the bust in terms of price falls, but it shows little sign of sales recovery, and it is a long, long way off of being a normal functioning market.
Rob Kitchin

August 15, 2013 at 1:02 pm
A lot of rich US business folks cashed in profits or sold companies in late 2012 to avoid changes in taxation. I wonder if that fueled the purchases at that time.
August 15, 2013 at 1:39 pm
I think it is mainly buyers trying to get in before the mortgage interest relief was ended.
August 15, 2013 at 4:09 pm
I think Rob is more right than Aaron.Could be an element of both.
Still a dead cat’s bounce.
August 15, 2013 at 4:14 pm
Forgot to add.
The steady graph indicates well heeled (often cash) buyers.
If you can get statistics on areas where property is moving,I bet the vast majority of these limited-if steady-house sales, are in the most desirable post codes in the Dublin region.
August 15, 2013 at 8:31 pm
The M1 money supply(money both electronic and paper used for exchange) is moving upwards at a considerable rate for 2013.
Any explanations for this ?
It cannot all be about “The gathering” of the external credit /debt thingy.although external buyers of property may have something more to do with it.
Have resident people decided to become liquid (destroy their term savings) so as to drink for the day ? or is something internal producing more credit /debt also?
Not much people talk about this kind of important thingy in the Irish economy la la land so I am just asking like as if you have no money or debt tokens in the system you can’t have a market and stuff.
August 16, 2013 at 8:02 am
@Dork I’m not really sure what you’re asking, sorry.
August 16, 2013 at 1:32 pm
Can you give a explanation for the recent surge in M1 ?
Its a simple question with perhaps a complex answer or perhaps not.
From a monetarist perspective the money supply dictates all physical actions.
Meanwhile in the Irish physical world electricity output has collapsed in recent months…..
The data coming through is very VERY strange to say the least but Ireland is such as hard place to read given its open free banking nature.
August 17, 2013 at 2:11 pm
I’m afraid I’m unfamiliar with M1.